COVID-19: Case demographics
Full details of the confirmed and probable cases of COVID-19 in New Zealand.
This data is updated weekly. All data on this page relates to cases recorded prior 11:59 pm 13 October 2025.
Last updated 2pm 13 October 2025.
This data is updated weekly. All data on this page relates to cases recorded prior to 11:59 pm 12 October 2025.
| Sex | Total cases | Hospitalisations for COVID-19 | ICU care for COVID-19 |
|---|---|---|---|
| Female | 1524166 | 23475 | 554 |
| Male | 1210938 | 23655 | 874 |
| Unknown | 2886 | 14 | 1 |
| Total | 2737990 | 47144 | 1429 |
| Age group | Total cases | Hospitalisations for COVID-19 | ICU care for COVID-19 |
|---|---|---|---|
| 0 to 9 | 229284 | 5242 | 108 |
| 10 to 19 | 334208 | 1273 | 33 |
| 20 to 29 | 441424 | 2293 | 35 |
| 30 to 39 | 459355 | 2875 | 81 |
| 40 to 49 | 393415 | 2948 | 133 |
| 50 to 59 | 352897 | 4418 | 205 |
| 60 to 69 | 265672 | 6371 | 322 |
| 70+ | 261686 | 21724 | 512 |
| Unknown | 49 | 0 | 0 |
| Total | 2737990 | 47144 | 1429 |
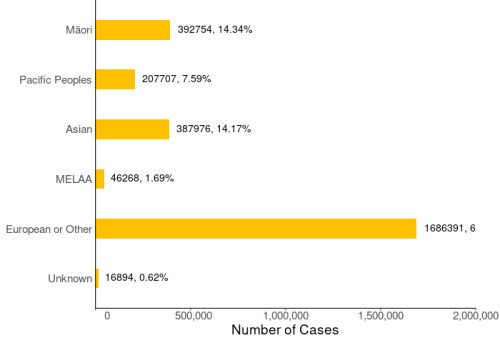
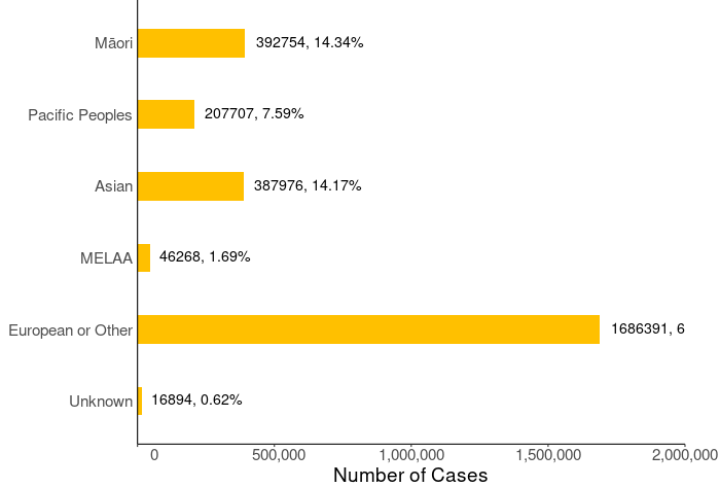
| Prioritised ethnicity* | Total cases | Hospitalisations for COVID-19 | ICU care for COVID-19 |
|---|---|---|---|
| Māori | 392754 | 7577 | 295 |
| Pacific Peoples | 207707 | 4936 | 172 |
| Asian | 387976 | 4477 | 107 |
| Middle Eastern, Latin American and African (MELAA) | 46268 | 742 | 13 |
| European or Other | 1686391 | 29307 | 836 |
| Unknown | 16894 | 105 | 6 |
| Total | 2737990 | 47144 | 1429 |
*The prioritised ethnicity classification system is used in this table and below. This means each person is allocated to a single ethnic group, based on the ethnic groups they identify with. Where people identify with more than one group, they are assigned in this order of priority: Māori, Pacific Peoples, Asian, and European or Other. So, if a person identifies as being Māori and New Zealand European, the person is counted as Māori.
Ngā tapuae me ngā raraunga: Methods and data sources
The data categorized by ethnicity come from National Health Index (NHI) data collection, linked to data held in the EpiSurv database.
Total cases and tests by ethnicity
| Total cases since first NZ case | Total tests for COVID-19 to date | |
|---|---|---|
| Māori | 392754 | 1,305,780 |
| Pacific Peoples | 207707 | 998,834 |
| Asian | 387976 | 1,381,979 |
| European or Other | 1732659 | 4,464,410 |
| Unknown | 16894 | 362,449 |
| Total | 2737990 | 8,513,452 |
Note: This table shows the number of tests, and some people are tested more than once.

| Ethnicity | Active (confirmed and probable) | Recovered | Deceased | Total cases since first case | Percentage of all cases |
|---|---|---|---|---|---|
| Māori | 14 | 392309 | 431 | 392754 | 14.3% |
| Pacific Peoples | 3 | 207469 | 235 | 207707 | 7.6% |
| Asian | 10 | 387779 | 187 | 387976 | 14.2% |
| Middle Eastern, Latin American and African (MELAA) | 2 | 46245 | 21 | 46268 | 1.7% |
| European or Other | 60 | 1682418 | 3913 | 1686391 | 61.6% |
| Unknown | 0 | 16878 | 16 | 16894 | 0.6% |
| Total | 89 | 2733098 | 4803 | 2737990 | 100% |

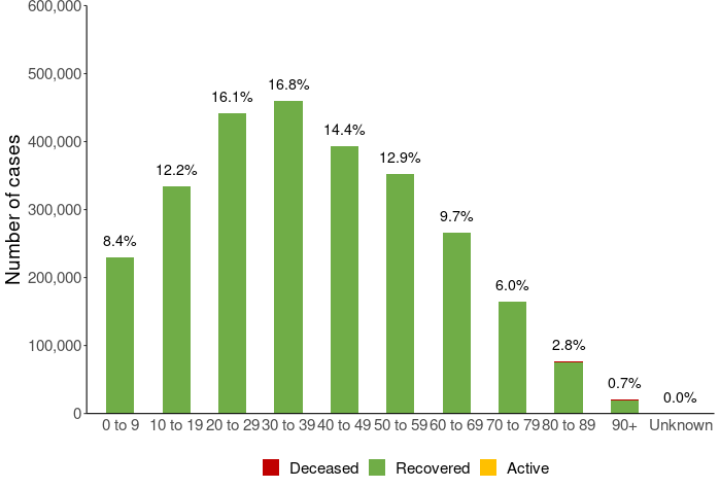

| Age group | Active (confirmed and probable) | Recovered | Deceased | Total cases | Percentage of all cases |
|---|---|---|---|---|---|
| 0 to 9 | 6 | 229264 | 14 | 229284 | 8.4% |
| 10 to 19 | 5 | 334196 | 7 | 334208 | 12.2% |
| 20 to 29 | 8 | 441401 | 15 | 441424 | 16.1% |
| 30 to 39 | 13 | 459307 | 35 | 459355 | 16.8% |
| 40 to 49 | 8 | 393339 | 68 | 393415 | 14.4% |
| 50 to 59 | 15 | 352731 | 151 | 352897 | 12.9% |
| 60 to 69 | 18 | 265265 | 389 | 265672 | 9.7% |
| 70 to 79 | 11 | 163892 | 965 | 164868 | 6% |
| 80 to 89 | 5 | 74752 | 1807 | 76564 | 2.8% |
| 90+ | 0 | 18902 | 1352 | 20254 | 0.7% |
| Unknown | 0 | 49 | 0 | 49 | 0% |
| Total | 89 | 2733098 | 4803 | 2737990 | 100% |
Total cases of COVID-19 by sex
| Sex | Active (confirmed and probable) | Recovered | Deceased | Total cases | Percentage of all cases |
|---|---|---|---|---|---|
| Female | 55 | 1521862 | 2249 | 1524166 | 56% |
| Male | 34 | 1208359 | 2545 | 1210938 | 44% |
| Unknown | 0 | 2877 | 9 | 2886 | 0% |
| Total | 89 | 2733098 | 4803 | 2737990 | 100% |
All deaths where someone has died within 28 days of being reported as having a positive test result for COVID-19 are now reported. This approach is in-line with that taken by other countries - such as the United Kingdom - and it ensures that all cases of COVID-19 who die are formally recorded to help provide an accurate assessment of the impact of COVID-19.
In many instances, further investigation will provide more information about the contribution of COVID-19 to their death.
This contribution can range from death not related, for instance someone with COVID-19 who dies in a car accident; to COVID-19 being a contributing cause, for example when someone dies with an existing health condition combined with COVID-19; and to COVID-19 being recorded as the cause of death.
Deaths that are still being investigated are reported as still to be classified.
Note: The "Unknown" column is currently not included in the table, yet is reflected in the row total count. We are currently reviewing our public facing COVID-19 reporting to also include 'Unknown'.
Note: Due to a change in the underlying IT systems, deaths attributed to COVID-19 will no longer be reported with the same recency, and COVID-19 attributed deaths will now be reported from the Mortality Collections only. This ensures that deaths have undergone systemic checks and include coronial inquest findings, which is in line with the reporting of deaths from other diseases, including other scheduled Notifiable Diseases. From the 17th of July 2025 only deaths recorded in the Mortality Collection will be reported as COVID-19 attributed. The most recent data in the Mortality Collection is for 2022 which is preliminary - more information can be found on the Mortality Collection webpage.
| Age group | Māori | Pacific Peoples | Asian | European or Other | Total |
|---|---|---|---|---|---|
| 0 to 59 | 176 | 73 | 45 | 291 | 589 |
| 60 to 69 | 151 | 68 | 25 | 405 | 655 |
| 70 to 79 | 190 | 94 | 69 | 1154 | 1510 |
| 80 to 89 | 150 | 102 | 116 | 2241 | 2613 |
| 90+ | 47 | 34 | 50 | 1640 | 1773 |
| Total | 714 | 371 | 305 | 5731 | 7140 |
| Age group | Māori | Pacific Peoples | Asian | European or Other | Total |
|---|---|---|---|---|---|
| 0 to 59 | 41 | 23 | 13 | 44 | 121 |
| 60 to 69 | 40 | 26 | 8 | 131 | 207 |
| 70 to 79 | 66 | 25 | 26 | 434 | 553 |
| 80 to 89 | 63 | 38 | 53 | 1015 | 1171 |
| 90+ | 26 | 21 | 24 | 880 | 953 |
| Total | 236 | 133 | 124 | 2504 | 3005 |
We publish details about every person with COVID-19 (confirmed or probable) in a downloadable spreadsheet. For privacy reasons, this data only includes:
This data covers all cases from 26 February 2020 to 6 October 2025 and is available from the Ministry's COVID-19 Data GitHub repository.
COVID-19 Data GitHub repository - Ministry of Health (external link)
Researchers can request detailed data on COVID-19 in New Zealand by sending an email to the Ministry of Health COVID-19 Response and Coordination team.
Please note that all data and statistics relating to COVID-19 vaccinations are available on the COVID-19 vaccine data page. This page is updated weekly at 1pm on Wednesday.