National Influenza Vaccine Data
Data and statistics about the rollout of the 2024 flu vaccine campaign in New Zealand.
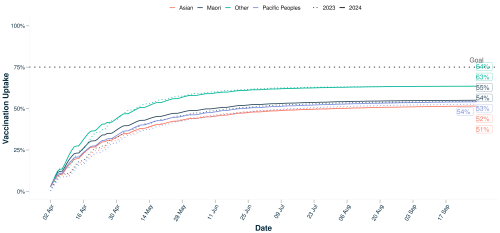
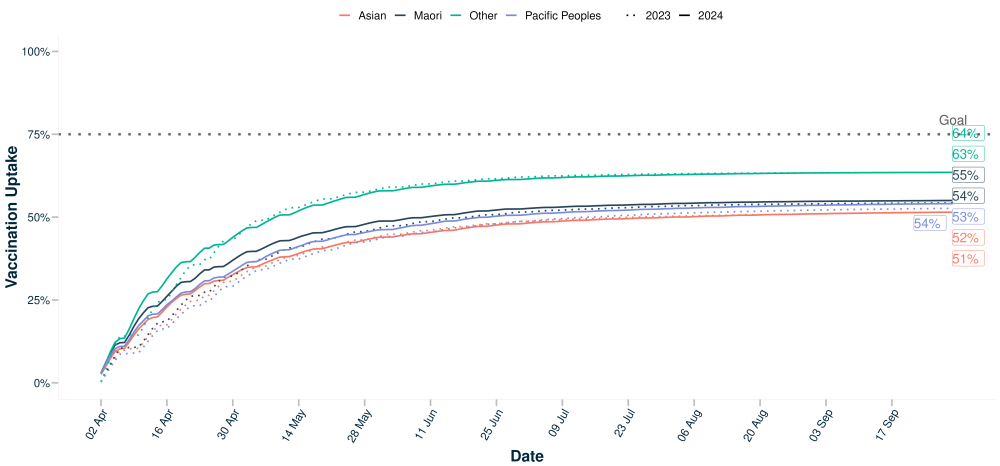
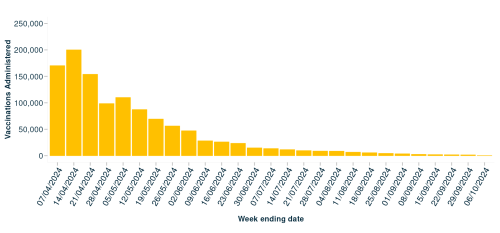
This page is updated weekly at 1 pm on Thursday. Vaccine data is up to 6 October 2024. Please note the final update to the content of this page will be made once the flu season had ended for the year, typically end of September.