Bowel Screening Pilot results
Find out about the Bowel Screening Pilot results
The Bowel Screening Pilot ran from January 2012 to December 2017. This report summarises data from Round 1 (January 2012 to December 2013), Round 2 (January 2014 to December 2015) and Round 3 (January 2016 to June 2017). The results from the Pilot have been used to plan and implement our National Bowel Screening Programme.
Results for people invited in Round 1 of the bowel screening pilot (invited from 1 January 2012 to 31 December 2013), Round 2 (invited from 1 January 2014 to 31 December 2015) and Round 3 (invited from 1 January 2016 to 30 June 2017) are summarised in this report.
Although the Pilot ran to the end of December 2017, the data on which this report is based covers people who returned their kits before 1 July 2017. On this date the National Bowel Screening Programme commenced and the threshold that triggered a positive result was changed[1]. To ensure the results from the Bowel Screening Pilot are consistent between the three rounds, any participant who returned a kit after the threshold change has been excluded from this report. This means that for the purposes of this report, Rounds 1 and 2 are reported for a standard 2 year period whereas Round 3 covers a period of 18 months. The exception to this is participation information – as the threshold change did not influence who returned a kit and who did not, participation rates have been assessed for the whole of Round 3, i.e. for all those invited from 1 January 2016 to 31 December 2017.
The results presented in this report can all be considered final. Results relating to participants who returned a test kit between 1 July and 31 December 2017 in the Waitemata population will be included in the National Bowel Screening Programme Annual Monitoring Report for 2017/18.
Some people taking part in Round 2 and Round 3 had also taken part in Round 1, but some were taking part in the pilot for the first time. International experience was mirrored in the New Zealand results: people who took part in a screening round were more likely to take part in the subsequent screening rounds. People who did not participate in a screening round were less likely to participate in the next screening round.
During Round 1 the participation for Pacific people was lower than for other ethnic groups. Final results show that for Rounds 2 and 3 this disparity lessened but did not disappear.
In Round 1, for some people the test kit was proving difficult to complete correctly on the first attempt. The problems did not actually relate to completing the test itself but rather to correctly completing the required documentation. The test kit instructions were revised at the end of Round 1 to make them more easily understood by all population groups, and this coincided with a notable and consistent increase in the number of people successfully completing their kit on their first attempt throughout the rest of the Pilot.
The bowel screening test can detect trace amounts of blood in bowel motions which indicate the need for further investigation. Blood in bowel motions may be caused by cancer, polyps (growths) or other non-cancerous bowel conditions.
If enough blood was found in a test sample to trigger a positive result, participants were offered a diagnostic colonoscopy to check for bowel cancer, or bowel polyps that may develop into cancer over time.
About 5 in 10 people who had a colonoscopy had adenomas detected. Adenomas may be removed at colonoscopy. Some participants with adenomas were advised to have regular colonoscopy in the future (known as surveillance).
About 4 in 100 people who had a colonoscopy after their first screening test through the Programme were found to have bowel cancer. For those taking part in Rounds 2 and 3, about 3 in 100 colonoscopies found bowel cancer. These patients were referred for treatment.
[1] Read an explanation of why the threshold was altered (Word, 245 KB).
In the first screening round (Round 1) a total of 120,828 eligible people were invited to take part and 69,336 people returned a correctly completed kit (and documentation) that could be tested by the laboratory.
In the second screening round (Round 2), a total of eligible 125,261 people were invited and 72,827 people returned a correctly completed kit.
In the third screening round (Round 3, those invited from 1 January 2016 to 31 December 2017), 141,126 eligible people were invited and 80,228 people returned a correctly completed kit.
The New Zealand participation rate for Round 1 of 57.4 percent was higher than the internationally acceptable minimum participation rate of 45.0 percent for first screening rounds.
For Round 2 and Round 3, participants can be divided into three groups:
The chart below shows the New Zealand participation rate (overall) for people invited during the three screening rounds, and for the three sub-groups of people invited in Round 2 and Round 3.
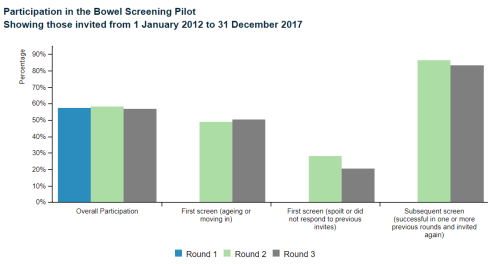


| Overall Participation | 57.4% | 58.1% | 56.8% | |
|---|---|---|---|---|
| First screen (ageing or moving in) | 49.0% | 50.3% | ||
| First screen (spoilt or did not respond to previous invites) | 28.1% | 20.6% | ||
| Subsequent screen (successful in one or more previous rounds and invited again) | 86.4% | 83.3% | ||
Source: Bowel Screening Pilot IT system
The data shows that the overall participation rates for Round 1, 2 and 3 were 57.4 percent, 58.1 percent and 56.8 percent respectively.
For people for whom Round 2 or Round 3 was their first screen, due to aging in or moving into the area, participation was lower than the overall rates. This may have been because the average age of a person in this group was 53 and participation is known to be much lower in younger age groups.
For people who were invited in Round 1, but either did not complete their kit correctly or did not take part, only 28.1 percent participated in Round 2.
The corresponding rate for Round 3 was 20.6 percent. A similar pattern is seen in international data; if a person did not take part in an initial screening round, they are less likely to take part when invited a second time.
For people who successfully took part in previous screening rounds (returning a kit that could be tested by the laboratory) it was very likely that they would return a successful kit in Rounds 2 and 3 (86.4 percent and 83.3 percent respectively). This is towards the higher range reported internationally.
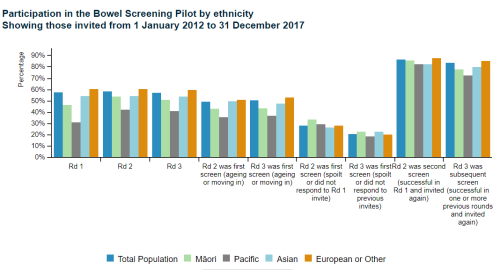
During Round 1 of the pilot, Pacific people were much less likely to participate than other population groups, but this disparity lessened in Rounds 2 and 3.
The chart below shows the participation rates, broken down by ethnicity, for people invited in Round 1 and for people invited in Rounds 2 and 3. In addition, the chart shows the data broken down into three sub-groups invited in Rounds 2 and 3.
The chart shows that the participation rate for Pacific people in Round 1 was about half that of the “European and Other” group. The final results for Rounds 2 and 3 show this gap, possibly in response to a number of initiatives, closed particularly when comparing those participants who took part in the screening programme for the first time.


| Total Population | Māori | Pacific | Asian | European or Other | |
|---|---|---|---|---|---|
| Rd 1 | 57.4% | 46.3% | 30.9% | 54.0% | 60.4% |
| Rd 2 | 58.1% | 53.7% | 41.9% | 54.0% | 60.4% |
| Rd 3 | 56.8% | 50.6% | 40.8% | 53.4% | 59.3% |
| Rd 2 was first screen (ageing or moving in) | 49.0% | 42.9% | 35.4% | 49.5% | 50.5% |
| Rd 3 was first screen (ageing or moving in) | 50.3% | 43.2% | 36.8% | 47.5% | 52.9% |
| Rd 2 was first screen (spoilt or did not respond to Rd 1 invite) | 28.1% | 33.2% | 29.2% | 26.5% | 27.9% |
| Rd 3 was first screen (spoilt or did not respond to previous invites) | 20.6% | 22.8% | 18.3% | 22.6% | 20.1% |
| Rd 2 was second screen (successful in Rd 1 and invited again) | 86.4% | 85.2% | 82.1% | 82.0% | 87.3% |
| Rd 3 was subsequent screen (successful in one or more previous rounds and invited again) | 83.3% | 77.6% | 72.0% | 79.6% | 84.9% |
Source: Bowel Screening Pilot IT system
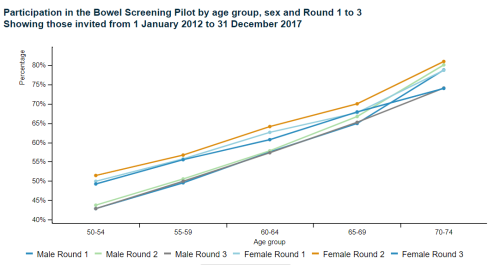
People aged between 50 and 74 years were eligible to take part in the pilot. Those in the younger age ranges were less likely to participate than those who were older and men were less likely to take part than women. The chart below shows the participation rate by age group and sex, for people invited in all three rounds.


| Male Round 1 | Male Round 2 | Male Round 3 | Female Round 1 | Female Round 2 | Female Round 3 | |
|---|---|---|---|---|---|---|
| 50-54 | 42.8% | 43.7% | 42.8% | 49.9% | 51.4% | 49.2% |
| 55-59 | 49.5% | 50.5% | 49.9% | 55.7% | 56.7% | 55.5% |
| 60-64 | 57.5% | 57.8% | 57.3% | 62.6% | 64.1% | 60.7% |
| 65-69 | 64.9% | 66.7% | 65.2% | 67.7% | 70.0% | 67.9% |
| 70-74 | 78.8% | 80.1% | 74.1% | 78.7% | 81.0% | 74.0% |
Source: Bowel Screening Pilot IT system
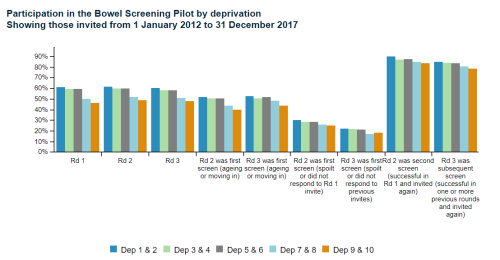
Participation rate also correlates to socio-economic deprivation. The chart below shows that those from the most deprived areas (deprivation grouping 9&10) were less likely to participate than those in the least deprived areas (deprivation grouping 1&2). The disparity seen in Round 1 between deprivation groups closed slightly as the pilot progressed.

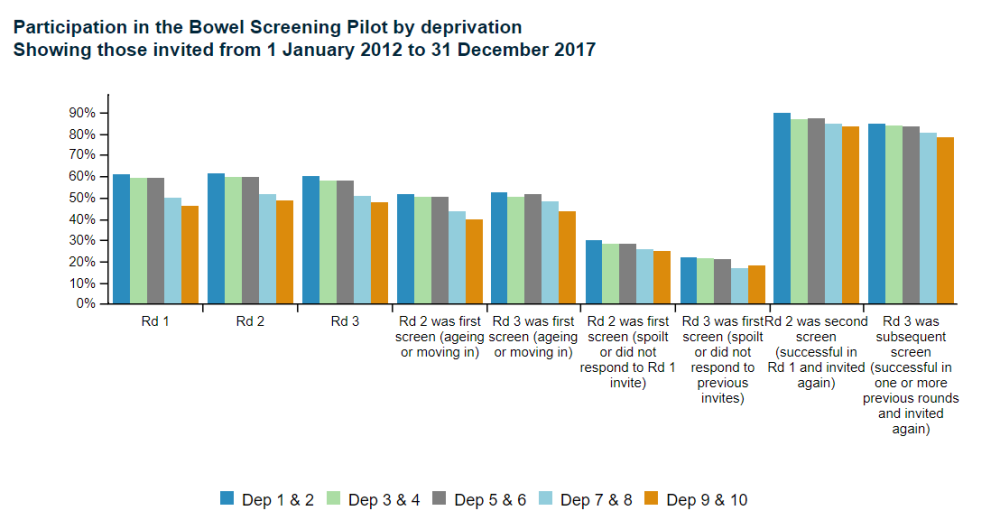
| Dep 1 & 2 | Dep 3 & 4 | Dep 5 & 6 | Dep 7 & 8 | Dep 9 & 10 | |||
|---|---|---|---|---|---|---|---|
| Rd 1 | 60.9% | 59.3% | 59.1% | 49.9% | 46.3% | ||
| Rd 2 | 61.3% | 59.5% | 59.7% | 51.7% | 48.8% | ||
| Rd 3 | 60.3% | 58.0% | 58.1% | 50.7% | 47.6% | ||
| Rd 2 was first screen (ageing or moving in) | 51.8% | 50.5% | 50.3% | 43.4% | 39.6% | ||
| Rd 3 was first screen (ageing or moving in) | 52.6% | 50.2% | 51.7% | 48.4% | 43.5% | ||
| Rd 2 was first screen (spoilt or did not respond to Rd 1 invite) | 30.1% | 28.3% | 28.4% | 25.6% | 25.0% | ||
| Rd 3 was first screen (spoilt or did not respond to previous invites) | 22.1% | 21.6% | 21.0% | 17.0% | 18.2% | ||
| Rd 2 was second screen (successful in Rd 1 and invited again) | 89.6% | 86.7% | 87.2% | 84.6% | 83.4% | ||
| Rd 3 was subsequent screen (successful in one or more previous rounds and invited again) | 84.6% | 83.7% | 83.6% | 80.6% | 78.5% | ||
Source: Bowel Screening Pilot IT system
Participants in the pilot were asked to complete a bowel screening test known as the faecal immunochemical test (FIT) for haemoglobin which detected blood in bowel motions. The FIT is also known as the immunochemical faecal occult blood test (iFOBT), and these names are used interchangeably[2].
In the Pilot, as in the National Programme, the FIT is sent to a designated laboratory for testing. Where enough blood is found in the sample to trigger a positive result, participants are offered a colonoscopy or other appropriate investigation.
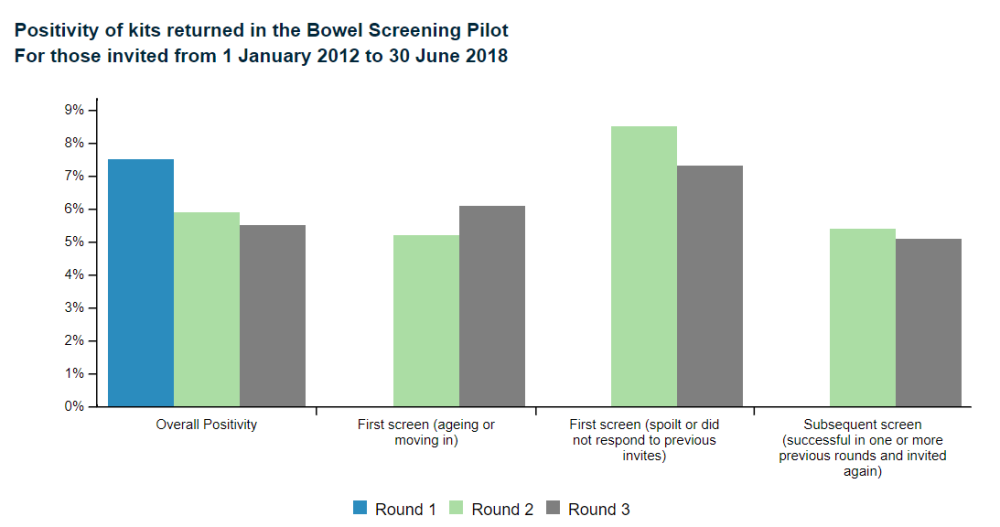
Of all participants who correctly completed their test kit, during Round 1, 7.5 percent were reported to have a positive test. This is known as the positivity rate. This is within the expected range when compared with other international bowel screening pilots of this type.
The positivity rates for the groups of people who were invited in Round 2 (between 1 January and 31 December 2015) and Round 3 (between 1 January and tested to 30 June 2017) are shown in the chart below. These results show similar trends seen internationally.
The positivity rate for people for whom Round 2 or Round 3 was their first screen, due to ageing in or moving into the area, was much lower than seen in Round 1 (5.2 percent for Round 2 and 6.1 percent for Round 3). This may be due to the average age of the people in this group being 53. Younger age groups are less likely to have a positive FIT result than older age groups.
[2] Although previous Ministry of Health publications have referred to ‘iFOBT’, FIT is now used to align with international literature.


| Round 1 | Round 2 | Round 3 | ||
|---|---|---|---|---|
| Overall Positivity | 7.5% | 5.9% | 5.5% | |
| First screen (ageing or moving in) | 5.2% | 6.1% | ||
| First screen (spoilt or did not respond to previous invites) | 8.5% | 7.3% | ||
| Subsequent screen (successful in one or more previous rounds and invited again) | 5.4% | 5.1% | ||
Source: Bowel Screening Pilot IT system
In Round 2, for people who were invited in Round 1, but either did not complete their kit correctly or did not take part, positivity was 8.5 percent – higher than that seen in Round 1. The value for the comparable group in Round 3 was 7.3 percent.
For people who successfully took part in one or more previous screening rounds (returning a kit that could be tested by the laboratory), positivity was lower than in Round 1 (5.4 percent for Round 2 and 5.1 percent for Round 3).
In first screening rounds, it is expected that positivity will be high - participants have not been screened before. After the first screen, participants who have had a positive test and a subsequent colonoscopy are not invited for the next screening round. Hence a lower positivity is expected in the succeeding screening rounds.
Not everyone completed the bowel screening test kit correctly on their first attempt, meaning some kits could not be analysed. This was usually because the test had not been labelled correctly - only a small proportion were because the test been performed incorrectly. These are known as ‘spoilt kits’.
Of all the first kits sent out between 1 January 2012 and 31 December 2013 (Round 1), and returned, 11.6 percent were spoilt on the first attempt. This figure dropped to 5.0 percent early in Round 2 and coincided with the introduction of new test kit instructions and other revised information for participants. Most people went on to complete a kit correctly, once another kit was sent to them. For Round 3, 4.5 percent of kits were spoilt on the first attempt.
The likelihood of a spoilt kit increases with the participant’s age. Some ethnic groups have higher rates of spoilt kits. This knowledge has informed the planning of the National Programme.
About 10,558 people received a colonoscopy (or a Computerised Tomographic Colonography - CTC if indicated for medical reasons) through the Bowel Screening Pilot. These people had all completed a test kit which was reported as positive.
Participants were generally being offered a colonoscopy within 11 weeks of the laboratory identifying that their test was positive. This timeframe is an important indicator of how well the pilot is working. It was monitored closely throughout the life of the Pilot.
CTCs accounted for around one percent of all diagnostic tests performed following a positive FIT result.
At the point at which the BSP data was extracted (1 June 2018) 388 people had a cancer detected through a colonoscopy delivered as part of the Bowel Screening Pilot in Round 1, Round 2 and Round 3[3]. A further 37 people had their cancer detected after returning a positive FIT and choosing to have a colonoscopy through a private provider. This was a total of 427 people being identified with cancer. More than one cancer was found in some people.
Of the 427 people who were diagnosed with cancer, 215 people were found to have cancer following an invitation during Round 1 (193 found publicly and 22 found privately), 120 people were found to have cancer following an invitation in Round 2 (108 found publicly and 12 found privately) and 90 people were found to have a cancer following an invitation in Round 3 (87 found publicly and 3 found privately).
The number of cancers found was at the lower end of the range of what would be expected when compared with international bowel screening programmes. The cancers were detected at an earlier stage than would be expected in a normal clinical setting where people visit their doctor because they have symptoms.
When a cancer was diagnosed, the participant was referred on for appropriate treatment and care. However, in approximately ten percent of cases, the cancer detected was confined within a polyp that was removed at colonoscopy and therefore surgery was not required.
In addition to finding cancers, the pilot also detected many non-cancerous polyps called adenomas, which grow on the wall of the bowel. These adenomas were removed at colonoscopy but despite this, some participants with adenomas will still be at increased risk of developing more adenomas or bowel cancer. These participants will require regular bowel checks by colonoscopy (surveillance) in the future.
[3] For those where their FIT was tested prior to 1 July 2017.
Sometimes complications arose following a colonoscopy especially if a participant had a large polyp, or a large number of polyps, removed from their bowel during the procedure.
Of those people who received a colonoscopy after receiving a positive test in the Bowel Screening Pilot, 113 were admitted to hospital to have further treatment or monitoring within 30 days of undergoing a colonoscopy within the pilot. Most of these admissions were for complications that were not considered to be serious and involved a short stay in hospital for observation.
More serious complications such as perforation of the bowel or bleeding usually resulted from interventions performed to remove polyps. The number of these intermediate and more serious complications was about what was expected given the number of participants identified as having polyps. Admission to hospital is an important quality measure and was monitored closely throughout the pilot.
A detailed set of monitoring indicators has been drawn up to evaluate the pilot. The results for all three Rounds are considered final. Results for Round 3 relate to any person invited after 1 January 2016 but whose kit was tested prior to 1 July 2017.
Additional analysis looking at the positivity, detection rates and positive predictive values by ethnicity are published online at Positivity, positive predictive values and detection rates by ethnicity.