Bowel screening pilot – positivity, positive predictive values and detection rates by ethnicity
See the bowel screening pilot – positivity, positive predictive values and detection rates by ethnicity
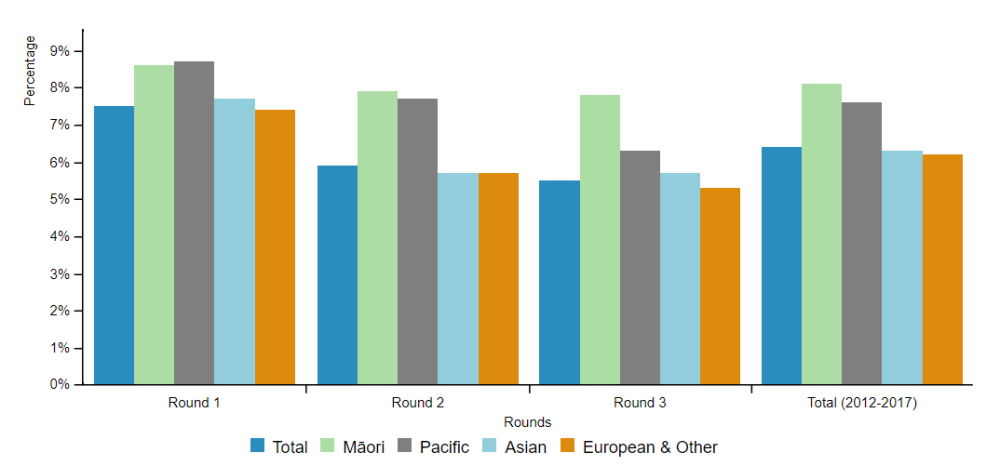
The positivity rate refers to the percentage of people returning a completed test kit who were tested as having a positive FIT during the first and subsequent screening rounds between 1 January 2012 and 30 June 2017.
Māori and Pacific participants had a higher proportion of positive tests compared with other participants in all Rounds (overall participation ws 6.4%). Overall, positivity was 8.1% and 7.6% for Māori and Pacific respectively compared with 6.3% for Asian and 6.2% for the European & Other group. The chart below shows the positivity rates by ethnicity for people invited in Round 1, Round 2 and Round 3.


| Total | Māori | Pacific | Asian | European & Other | |
|---|---|---|---|---|---|
| Round 1 | 7.5 | 8.6 | 8.7 | 7.7 | 7.4 |
| Round 2 | 5.9 | 7.9 | 7.7 | 5.7 | 5.7 |
| Round 3 | 5.5 | 7.8 | 6.3 | 5.7 | 5.3 |
| Total (2012-2017) | 6.4 | 8.1 | 7.6 | 6.3 | 6.2 |
Source: Bowel Screening Pilot IT system
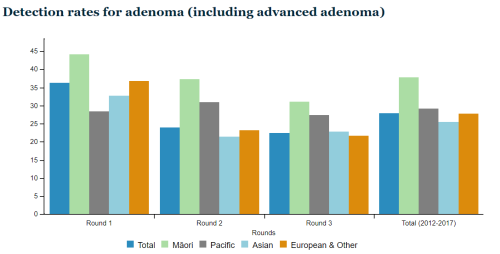
The detection rate for adenoma, advanced adenoma or cancer is the number of people diagnosed with any adenoma, advanced adenoma or colorectal cancer per 1000 people screened with a FIT result available. The charts below show this information for Rounds 1, 2 and 3, as well as an overall rate for the whole period (invited from 1 January 2012 with a FIT tested up to 30 June 2017). All data relates to information collected via a publicly performed colonoscopy.
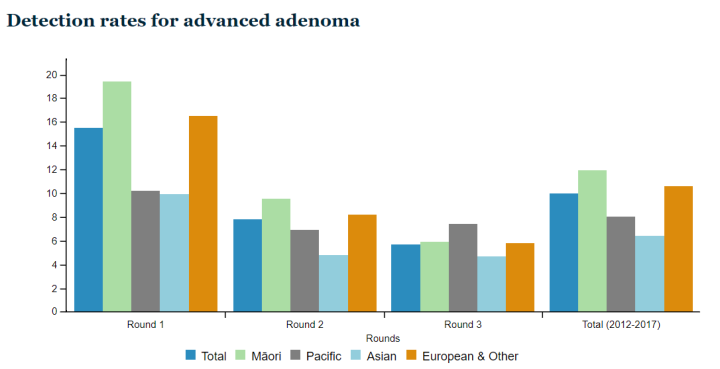
For adenoma, advanced adenoma and cancer, Māori participants generally showed the highest detection rates.


| Total | Māori | Pacific | Asian | European & Other | |
|---|---|---|---|---|---|
| Round 1 | 36.3 | 44.1 | 28.4 | 32.7 | 36.7 |
| Round 2 | 23.9 | 37.2 | 30.9 | 21.4 | 23.2 |
| Round 3 | 22.4 | 31 | 27.4 | 22.8 | 21.6 |
| Total (2012-2017) | 27.9 | 37.8 | 29.1 | 25.5 | 27.8 |
Source: Bowel Screening Pilot IT system


| Total | Māori | Pacific | Asian | European & Other | |
|---|---|---|---|---|---|
| Round 1 | 15.5 | 19.4 | 10.2 | 9.9 | 16.5 |
| Round 2 | 7.8 | 9.5 | 6.9 | 4.8 | 8.2 |
| Round 3 | 5.7 | 5.9 | 7.4 | 4.7 | 5.8 |
| Total (2012-2017) | 10 | 11.9 | 8 | 6.4 | 10.6 |
Source: Bowel Screening Pilot IT system


| Total | Māori | Pacific | Asian | European & Other | |
|---|---|---|---|---|---|
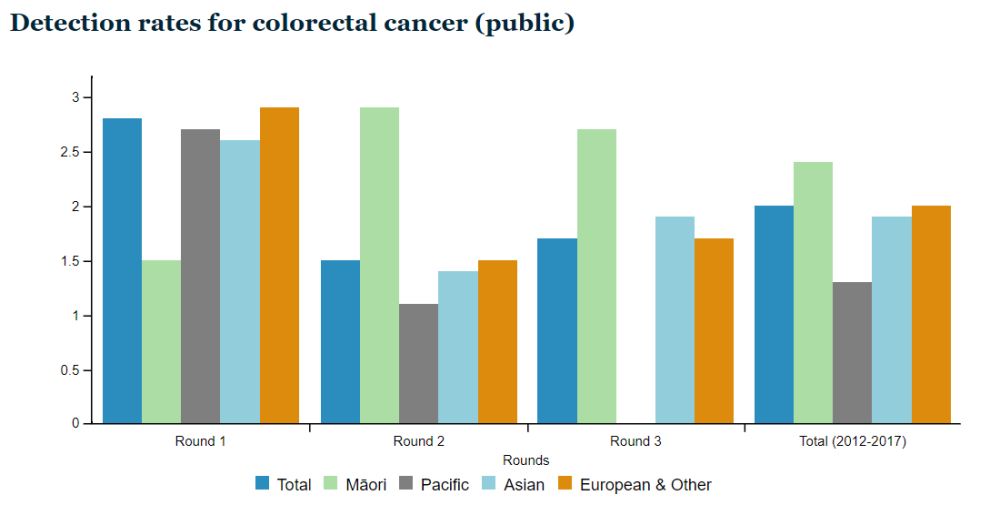
| Round 1 | 2.8 | 1.5 | 2.7 | 2.6 | 2.9 |
| Round 2 | 1.5 | 2.9 | 1.1 | 1.4 | 1.5 |
| Round 3 | 1.7 | 2.7 | 0 | 1.9 | 1.7 |
| Total (2012-2017) | 2 | 2.4 | 1.3 | 1.9 | 2 |
Source: Bowel Screening Pilot IT system
The PPV for adenoma, advanced adenoma or colorectal cancer is the percentage of people undergoing colonoscopy who were identified to have any adenoma, advanced adenoma or colorectal cancer. The charts below show this information for Rounds 1, 2 and 3, as well as an average for the whole period (invited from 1 January 2012 and with a FIT tested to 30 June 2017). All data relates to information collected via a publicly performed colonoscopy.
In general, Māori and the European/Other group showed the highest PPVs for adenoma and advanced adenoma.
Pacific showed the lowest PPV for cancer, although the numbers of cancers identified in Pacific (8) are very low and should be treated with caution.
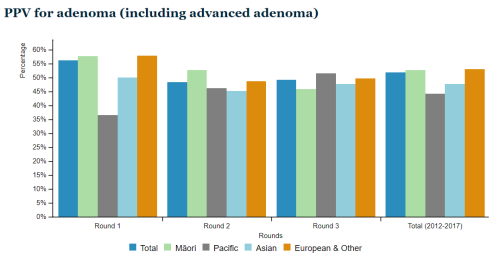


| Total | Māori | Pacific | Asian | European & Other | |
|---|---|---|---|---|---|
| Round 1 | 56.2 | 57.8 | 36.6 | 50.1 | 57.9 |
| Round 2 | 48.4 | 52.7 | 46.3 | 45.2 | 48.8 |
| Round 3 | 49.2 | 45.9 | 51.5 | 47.8 | 49.7 |
| Total (2012-2017) | 51.9 | 52.8 | 44.2 | 47.8 | 53 |
Source: Bowel Screening Pilot IT system

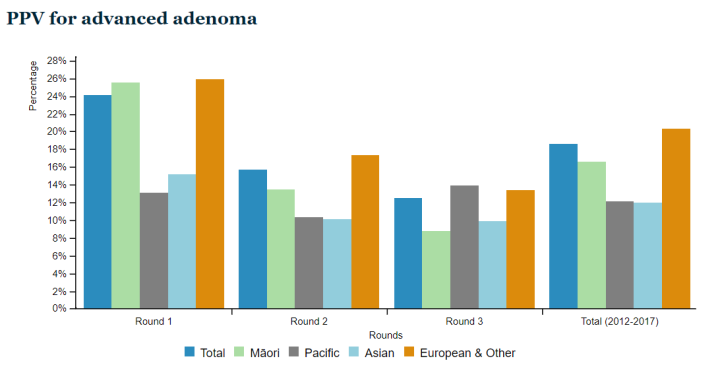

| Total | Māori | Pacific | Asian | European & Other | |
|---|---|---|---|---|---|
| Round 1 | 24.1 | 25.5 | 13.1 | 15.2 | 25.9 |
| Round 2 | 15.7 | 13.5 | 10.3 | 10.1 | 17.3 |
| Round 3 | 12.5 | 8.8 | 13.9 | 9.9 | 13.4 |
| Total (2012-2017) | 18.6 | 16.6 | 12.1 | 12 | 20.3 |
Source: Bowel Screening Pilot IT system


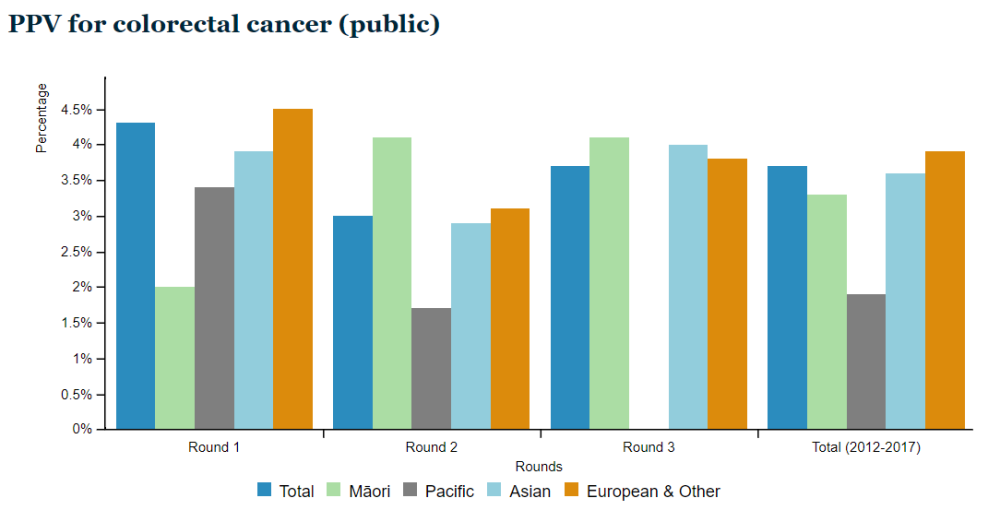
| Total | Māori | Pacific | Asian | European & Other | |
|---|---|---|---|---|---|
| Round 1 | 4.3 | 2 | 3.4 | 3.9 | 4.5 |
| Round 2 | 3 | 4.1 | 1.7 | 2.9 | 3.1 |
| Round 3 | 3.7 | 4.1 | 0 | 4 | 3.8 |
| Total (2012-2017) | 3.7 | 3.3 | 1.9 | 3.6 | 3.9 |
Source: Bowel Screening Pilot IT system
This information was sourced from the Bowel Screening Pilot IT system on 1 June 2018.
Some numbers relating to Māori and Pacific populations are small and so should be treated with caution.