Last updated 2pm 5 August 2024.

This data is updated weekly. All data on this page relates to cases recorded prior to 11:59 pm 4 August 2024.

COVID-19 cases summary

          New case average*

     RATs uploaded average*

                      213 ↓

                   268 

Cases in hospital as at midnight Sunday

Cases in ICU as at midnight Sunday

                       126 

                       **

Deaths attributed to COVID*

Total deaths attributed COVID

                        2 

                    4,299

* 7 day rolling average

** Not available

Current situation

Summary

In the last week New cases reported 2003
Reinfections 1201
Reinfections (< 90 days) 38
Total since first New Zealand case Cases reported 2686914
Reinfections 395901
Reinfections (< 90 days) 26821


Case outcomes since first New Zealand case
 

COVID-19 cases Change in the last week Total
Recovered 1735 2681127
Deceased* 15 4299*

*The Ministry of Health has recently switched its definition of 'deceased' from deaths within 28 days of testing positive for COVID-19 to deaths attributed to COVID-19. See the definitions section below for further details.

Deaths with COVID-19

Cause of death Died within 28 days of positive test Died more than 28 days after positive test Total Change in the last week
COVID as underlying 2556 147 2703 7
COVID as contributory 1467 129 1596 8
COVID-attributed total 4023 276 4299 15
Not COVID 2030 0* 2030 13
Not available 304 0 304 14
Total 6357 276 6633 42*

*The change in total deaths with COVID may not be equal to the number of new deaths reported today. This is because deaths that occurred more than 28 days after a positive test that are subsequently determined to be unrelated to COVID are removed from the total.

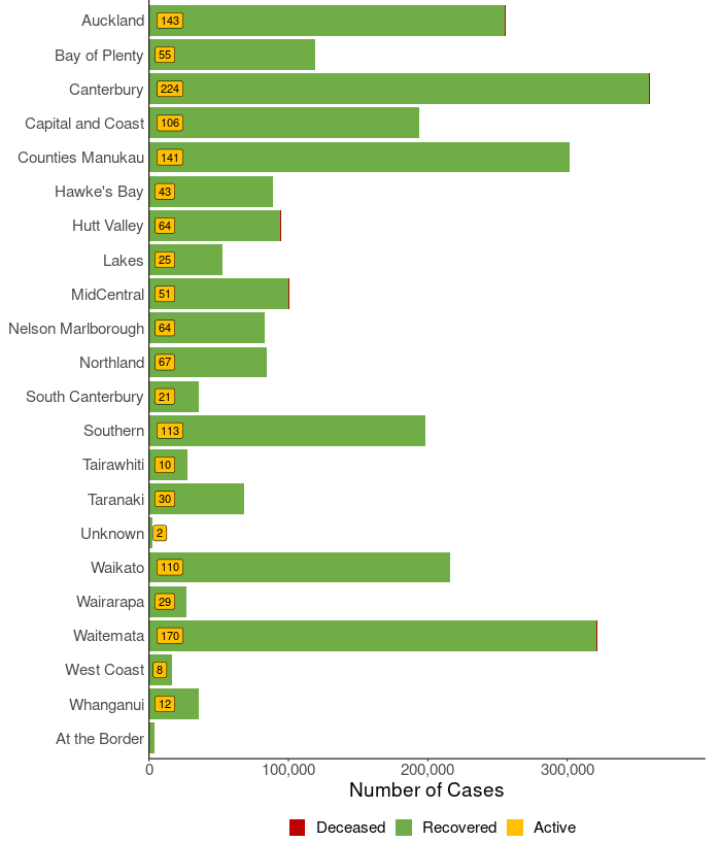
Of the 42 people whose deaths we are reporting today: two were from Northland, nine were from Auckland region, six were from Waikato, four were from Bay of Plenty, one was from Tairawhiti, two were from Taranaki, four were from MidCentral, three were from Wellington region, one was from Nelson Marlborough, six were from Canterbury, one was from West Coast, three were from Southern.

One was in their 30s, one was in their 40s, one was in their 50s, six were in their 60s, two were in their 70s, 17 were in their 80s and 14 were aged over 90. Of these people, 19 were women and 22 were men.

Case details

Number of active cases

  Change in the last week Total since first NZ case
Confirmed 1481 2640529
Probable 9 46385
Total 1490* 2686914

*The change in total case numbers may not be equal to the number of new cases reported today due to data updating and reconciliation.

Definitions

Active case - confirmed Confirmed cases are people who have received a positive PCR test OR someone who has received a positive result on a Rapid Antigen Test. For more details, see the COVID-19 case definition.
Active case - probable A probable case is when someone is diagnosed based on their exposure to other people with COVID-19 and on their symptoms. 
Reinfections Reinfections are cases in an individual who reported a case 29 or more days previously.  
Recovered Recovered cases are people who had the virus, where at least 7 days have passed since their symptoms started and they have not had symptoms for 72 hours, and they have been cleared by the health professional responsible for their monitoring.
Deceased Includes all deaths where COVID-19 is determined to have been the underlying cause of death or a contributory cause of death.


Cases reported each day

Daily confirmed and probable cases

New COVID-19 cases reported each day New COVID-19 cases reported each day New COVID-19 cases reported each day

This graph shows the count of all cases of COVID-19 every day (all cases – confirmed and probable) since the first New Zealand case in late February 2020. The graph shows the rapid increase of daily cases from mid-February 2022 to early March 2022, driven by the Omicron variant.

From mid-March to mid-April 2022, cases rapidly declined, followed by a period of slower decline until early July. This was followed by a rapid increase in cases, peaking in August before a steady decline in new daily cases. Reported new daily cases hit their lowest since February 2022 in September 2022.

New COVID-19 cases reported each day

This graph shows the count of all cases of COVID-19 every day (all cases – confirmed and probable) since the first New Zealand case in late February 2020. The graph shows the rapid increase of daily cases from mid-February 2022 to early March 2022, driven by the Omicron variant.

From mid-March to mid-April 2022, cases rapidly declined, followed by a period of slower decline until early July. This was followed by a rapid increase in cases, peaking in August before a steady decline in new daily cases. Reported new daily cases hit their lowest since February 2022 in September 2022.

COVID-19 by location

Total cases by location

Total COVID-19 cases by location graph Total COVID-19 cases by location graph Total COVID-19 cases by location graph

This bar graph shows the total cases and their status by health district and those with recent travel history.

The ‘At the border’ data group includes cases detected in managed isolation or quarantine facilities from the period when these were operating, as well as cases with recent travel history from after that time. They are not included in the district totals. Before 17 June, people in managed isolation or quarantine facilities were included in the total of the relevant district.

Total COVID-19 cases by location graph

This bar graph shows the total cases and their status by health district and those with recent travel history.

The ‘At the border’ data group includes cases detected in managed isolation or quarantine facilities from the period when these were operating, as well as cases with recent travel history from after that time. They are not included in the district totals. Before 17 June, people in managed isolation or quarantine facilities were included in the total of the relevant district.

Total cases by location

Location Active Recovered Deceased Total New cases in the last week
Auckland 143 255405 297 255845 200
Bay of Plenty 55 118835 204 119094 75
Canterbury 224 358304 590 359118 284
Capital and Coast 106 193409 196 193711 144
Counties Manukau 141 301266 342 301749 196
Hawke's Bay 43 88557 180 88780 56
Hutt Valley 64 94392 104 94560 87
Lakes 25 52669 116 52810 29
Mid Central 51 100116 225 100392 70
Nelson Marlborough 64 82996 176 83236 77
Northland 67 84124 162 84353 79
South Canterbury 21 35806 49 35876 29
Southern 113 197944 412 198469 149
Tairāwhiti 10 27437 49 27496 14
Taranaki 30 67862 138 68030 44
Unknown 2 2390 9 2401 3
Waikato 110 215724 439 216273 162
Wairarapa 29 26731 69 26829 43
Waitematā 170 321014 435 321619 236
West Coast 8 16287 23 16318 10
Whanganui 12 35730 79 35821 16
At the Border* 0 4129 5 4134 NA
Total 1488 2681127 4299 2686914 2003


* Due to retiring the COVID-19 Protection Framework on 12 September 2022, the Ministry of Health no longer separately reports COVID-19 cases who have recently travelled overseas. These cases will be included in the weekly reporting on all COVID-19 community cases, but we will no longer distinguish between border and other cases.


You can also view a detailed breakdown of daily case numbers for each district since the beginning of the pandemic by clicking the ‘download’ button on the right hand side of this page: New Zealand COVID-19 data.


Note: we cannot give detailed information about cases in your district, city or town, as we must protect the privacy of the people concerned.