National Influenza Vaccine Data
Data and statistics about the rollout of the 2024 flu vaccine campaign in New Zealand.
This page is updated weekly at 1 pm on Thursday. Vaccine data is up to 28 April 2024.
Immunisation data is collected from Aotearoa Immunisation Register (AIR) and is collated weekly.
We report both publicly funded and some privately funded flu vaccines that are recorded. Not all the privately funded vaccines are recorded in our registries which means the total number of vaccines administered will be higher than reported. Influenza vaccines are funded under several criteria, further details here: Influenza vaccine | Health Navigator NZ.Our reporting is focussed on the 2024 funded age groups.
| Māori | Pacific | Asian | Other | Total | |
|---|---|---|---|---|---|
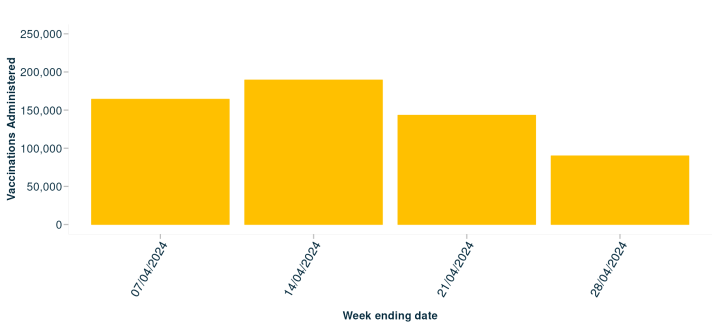
| Week: 22 April to 28 April | 7,173 | 4,518 | 14,515 | 63,899 | 90,105 |
| Total Vaccinations 6M-12 years (YTD) | 1,402 | 1,215 | 6,651 | 6,626 | 15,894 |
| Total Vaccinations 65+ years (YTD) | 21,284 | 10,109 | 24,651 | 287,534 | 343,578 |
| Total Vaccinations (YTD) | 44,607 | 25,157 | 77,951 | 439,710 | 587,425 |
Number of vaccines by district and prioritised ethnicity. Based on the district of where the person lives, which may differ from where the person received their vaccine.
| Māori | Pacific | Asian | Other | Total | |
|---|---|---|---|---|---|
| Auckland | 2,302 | 4,176 | 15,136 | 30,540 | 52,154 |
| Bay of Plenty | 3,932 | 313 | 1,604 | 27,945 | 33,794 |
| Canterbury | 3,501 | 1,282 | 7,535 | 69,387 | 81,705 |
| Capital and Coast | 2,517 | 1,936 | 5,738 | 33,203 | 43,394 |
| Counties Manukau | 4,389 | 9,660 | 15,790 | 23,789 | 53,628 |
| Hawkes Bay | 2,486 | 440 | 812 | 17,172 | 20,910 |
| Hutt Valley | 1,776 | 1,067 | 2,810 | 14,883 | 20,536 |
| Lakes | 2,178 | 215 | 636 | 8,020 | 11,049 |
| MidCentral | 1,870 | 330 | 1,277 | 19,239 | 22,716 |
| Nelson Marlborough | 1,203 | 367 | 867 | 21,515 | 23,952 |
| Northland | 3,275 | 226 | 572 | 13,782 | 17,855 |
| South Canterbury | 352 | 152 | 359 | 8,322 | 9,185 |
| Southern | 2,179 | 625 | 2,419 | 37,981 | 43,204 |
| Tairāwhiti | 1,277 | 85 | 151 | 2,319 | 3,832 |
| Taranaki | 1,390 | 113 | 611 | 13,703 | 15,817 |
| Waikato | 4,890 | 922 | 3,793 | 36,827 | 46,432 |
| Wairarapa | 612 | 95 | 141 | 6,343 | 7,191 |
| Waitematā | 2,906 | 2,979 | 17,308 | 44,179 | 67,372 |
| West Coast | 318 | 30 | 149 | 3,859 | 4,356 |
| Whanganui | 1,244 | 133 | 208 | 6,582 | 8,167 |
| Overseas / Unknown | 10 | 11 | 35 | 120 | 176 |
| Total | 44,607 | 25,157 | 77,951 | 439,710 | 587,425 |
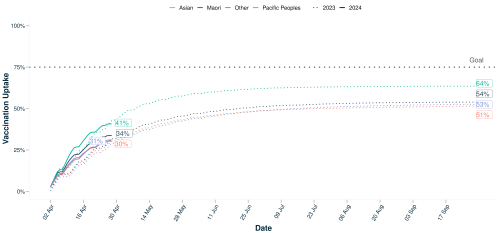
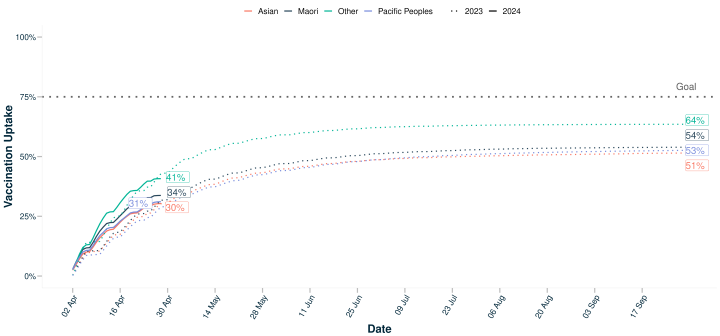
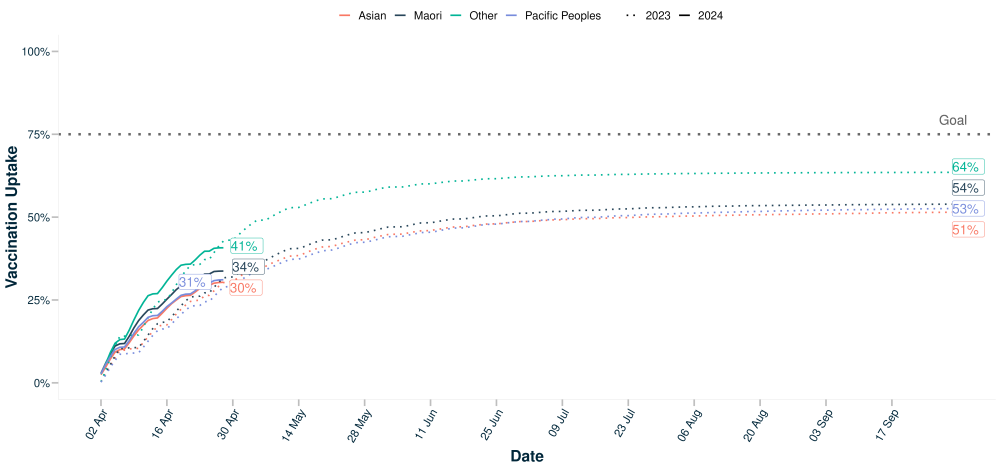
Uptake percent is calculated by comparing the flu doses to date for this year with the estimated number of people in New Zealand who are aged 65 and over.
The estimated population is sourced from AIR and validated against the National Health Index (NHI) and National Enrolment Service (NES) registers.
The equity gap is the difference in rates for Māori or Pacific ethnicities to non-Māori/non-Pacific.
| Māori | Pacific | Asian | Other | Total | Equity Gap | |||||||
|---|---|---|---|---|---|---|---|---|---|---|---|---|
| count | % | count | % | count | % | count | % | count | % | (Māori) | (Pacific) | |
| Auckland | 945 | 35% | 1,763 | 30% | 5,609 | 30% | 17,307 | 39% | 25,624 | 36% | -1% | -6% |
| Bay of Plenty | 2,185 | 36% | 129 | 36% | 365 | 28% | 20,450 | 43% | 23,129 | 42% | -7% | -7% |
| Canterbury | 1,401 | 38% | 363 | 32% | 1,831 | 33% | 43,362 | 46% | 46,957 | 45% | -7% | -13% |
| Capital and Coast | 948 | 40% | 835 | 35% | 1,631 | 33% | 17,722 | 47% | 21,136 | 44% | -5% | -10% |
| Counties Manukau | 1,795 | 34% | 3,914 | 30% | 5,868 | 30% | 15,505 | 38% | 27,082 | 34% | -1% | -5% |
| Hawkes Bay | 1,171 | 29% | 124 | 28% | 192 | 27% | 12,136 | 41% | 13,623 | 39% | -11% | -13% |
| Hutt Valley | 755 | 40% | 518 | 41% | 886 | 36% | 8,702 | 46% | 10,861 | 44% | -5% | -4% |
| Lakes | 1,265 | 34% | 86 | 31% | 148 | 27% | 5,818 | 37% | 7,317 | 36% | -2% | -5% |
| MidCentral | 973 | 35% | 140 | 29% | 437 | 33% | 13,235 | 42% | 14,785 | 41% | -7% | -13% |
| Nelson Marlborough | 577 | 41% | 51 | 30% | 131 | 33% | 15,378 | 43% | 16,137 | 43% | -3% | -13% |
| Northland | 1,869 | 26% | 114 | 29% | 139 | 22% | 10,761 | 30% | 12,883 | 30% | -4% | -1% |
| South Canterbury | 164 | 41% | 18 | 38% | 45 | 31% | 5,658 | 42% | 5,885 | 42% | -1% | -4% |
| Southern | 924 | 36% | 172 | 34% | 333 | 31% | 23,463 | 40% | 24,892 | 39% | -4% | -5% |
| Tairāwhiti | 750 | 27% | 21 | 23% | 20 | 22% | 1,614 | 28% | 2,405 | 28% | -1% | -5% |
| Taranaki | 699 | 37% | 29 | 29% | 107 | 31% | 9,306 | 42% | 10,141 | 41% | -4% | -13% |
| Waikato | 2,450 | 32% | 374 | 31% | 1,050 | 27% | 25,924 | 40% | 29,798 | 38% | -7% | -8% |
| Wairarapa | 319 | 42% | 42 | 40% | 52 | 39% | 4,696 | 43% | 5,109 | 43% | -1% | -2% |
| Waitematā | 1,194 | 32% | 1,324 | 30% | 5,696 | 29% | 28,456 | 38% | 36,670 | 36% | -4% | -6% |
| West Coast | 158 | 44% | 9 | 39% | 20 | 34% | 2,608 | 37% | 2,795 | 37% | 7% | 3% |
| Whanganui | 690 | 39% | 51 | 32% | 49 | 27% | 4,838 | 38% | 5,628 | 38% | 1% | -6% |
| Overseas / Unknown | - | 10% | - | 0% | 6 | 6% | 48 | 8% | 58 | 7% | 2% | -8% |
| Total | 21,236 | 34% | 10,077 | 31% | 24,615 | 30% | 286,987 | 41% | 342,915 | 39% | -6% | -9% |
| Māori | Pacific | Asian | Other | Total | Equity Gap | |||||||
|---|---|---|---|---|---|---|---|---|---|---|---|---|
| count | % | count | % | count | % | count | % | count | % | (Māori) | (Pacific) | |
| Auckland | 89 | 1% | 199 | 2% | 1,281 | 5% | 780 | 3% | 2,349 | 3% | -3% | -2% |
| Bay of Plenty | 90 | 1% | 7 | 1% | 101 | 2% | 237 | 1% | 435 | 1% | -1% | -1% |
| Canterbury | 168 | 1% | 129 | 3% | 764 | 4% | 1,314 | 2% | 2,375 | 3% | -2% | 0% |
| Capital and Coast | 86 | 1% | 79 | 2% | 391 | 4% | 829 | 4% | 1,385 | 3% | -3% | -2% |
| Counties Manukau | 204 | 1% | 484 | 1% | 1,319 | 4% | 432 | 2% | 2,439 | 2% | -2% | -1% |
| Hawkes Bay | 37 | 0% | 22 | 1% | 30 | 1% | 112 | 1% | 201 | 1% | -1% | 0% |
| Hutt Valley | 64 | 1% | 26 | 1% | 186 | 3% | 288 | 3% | 564 | 2% | -2% | -2% |
| Lakes | 49 | 0% | 8 | 1% | 60 | 3% | 84 | 1% | 201 | 1% | -1% | 0% |
| MidCentral | 37 | 0% | 10 | 1% | 89 | 2% | 147 | 1% | 283 | 1% | -1% | -1% |
| Nelson Marlborough | 56 | 1% | 41 | 5% | 53 | 3% | 221 | 1% | 371 | 2% | 0% | 4% |
| Northland | 58 | 0% | 10 | 1% | 36 | 2% | 96 | 1% | 200 | 1% | -1% | 0% |
| South Canterbury | - | 0% | 22 | 4% | 17 | 2% | 56 | 1% | 98 | 1% | -1% | 3% |
| Southern | 76 | 1% | 14 | 1% | 127 | 2% | 403 | 1% | 620 | 1% | -1% | -1% |
| Tairāwhiti | 11 | 0% | - | 0% | 5 | 1% | 13 | 0% | 29 | 0% | 0% | -1% |
| Taranaki | 61 | 1% | 13 | 3% | 61 | 3% | 180 | 1% | 315 | 1% | -1% | 1% |
| Waikato | 116 | 0% | 25 | 1% | 285 | 2% | 410 | 1% | 836 | 1% | -1% | -1% |
| Wairarapa | 13 | 1% | 10 | 4% | 10 | 2% | 76 | 2% | 109 | 1% | -1% | 2% |
| Waitematā | 137 | 1% | 110 | 1% | 1,792 | 5% | 827 | 2% | 2,866 | 3% | -2% | -2% |
| West Coast | 16 | 2% | - | 1% | 16 | 5% | 60 | 2% | 93 | 2% | -1% | -1% |
| Whanganui | 29 | 1% | - | 1% | 10 | 1% | 52 | 1% | 94 | 1% | 0% | 0% |
| Overseas / Unknown | - | 0% | - | 1% | - | 0% | 6 | 1% | 7 | 1% | -1% | 0% |
| Total | 1,400 | 1% | 1,214 | 1% | 6,633 | 4% | 6,623 | 2% | 15,870 | 2% | -2% | -1% |